
Do you optimize the bundle size of your website??
Optimizing bundle size improves website performance, reduces load times, and enhances user experience. Large bundles slow rendering, increase memory usage, and hurt SEO. By minimizing dependencies, using tree shaking, code splitting, and dynamic imports, developers ensure only necessary code loads. This leads to faster interactions, lower bandwidth use, and better mobile performance, making optimization essential for a smooth web experience.
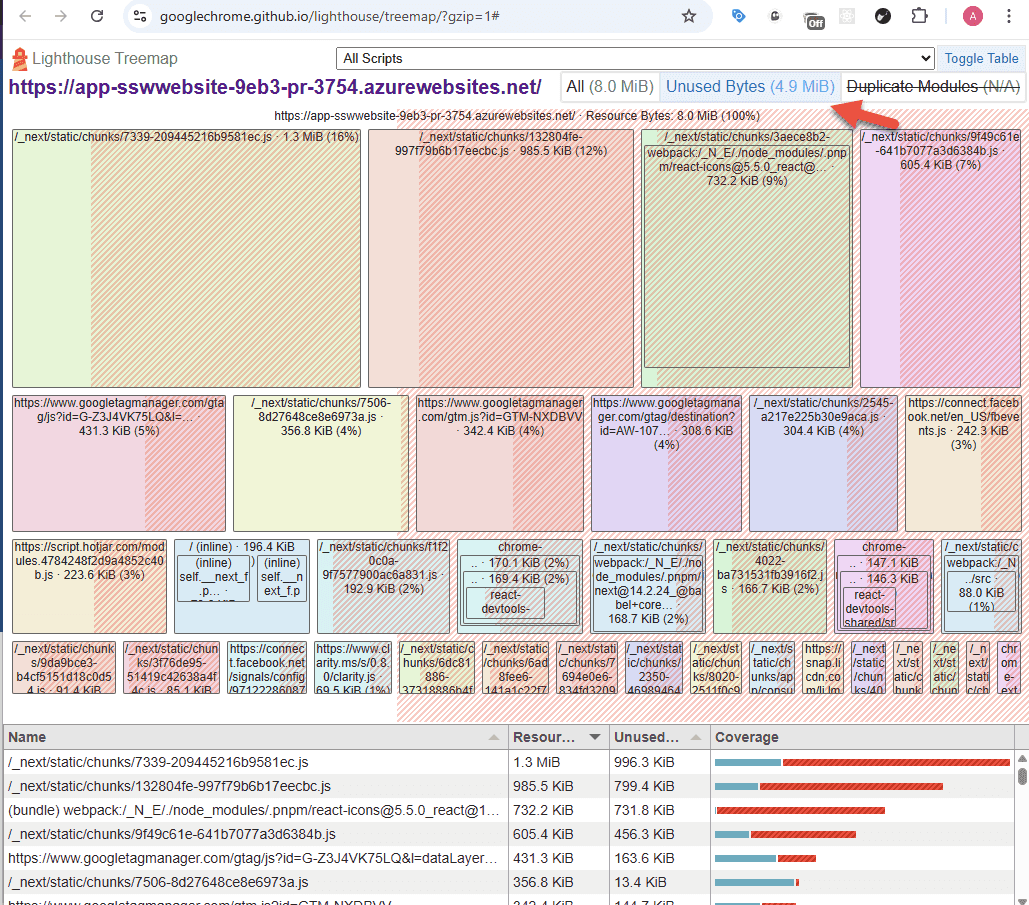
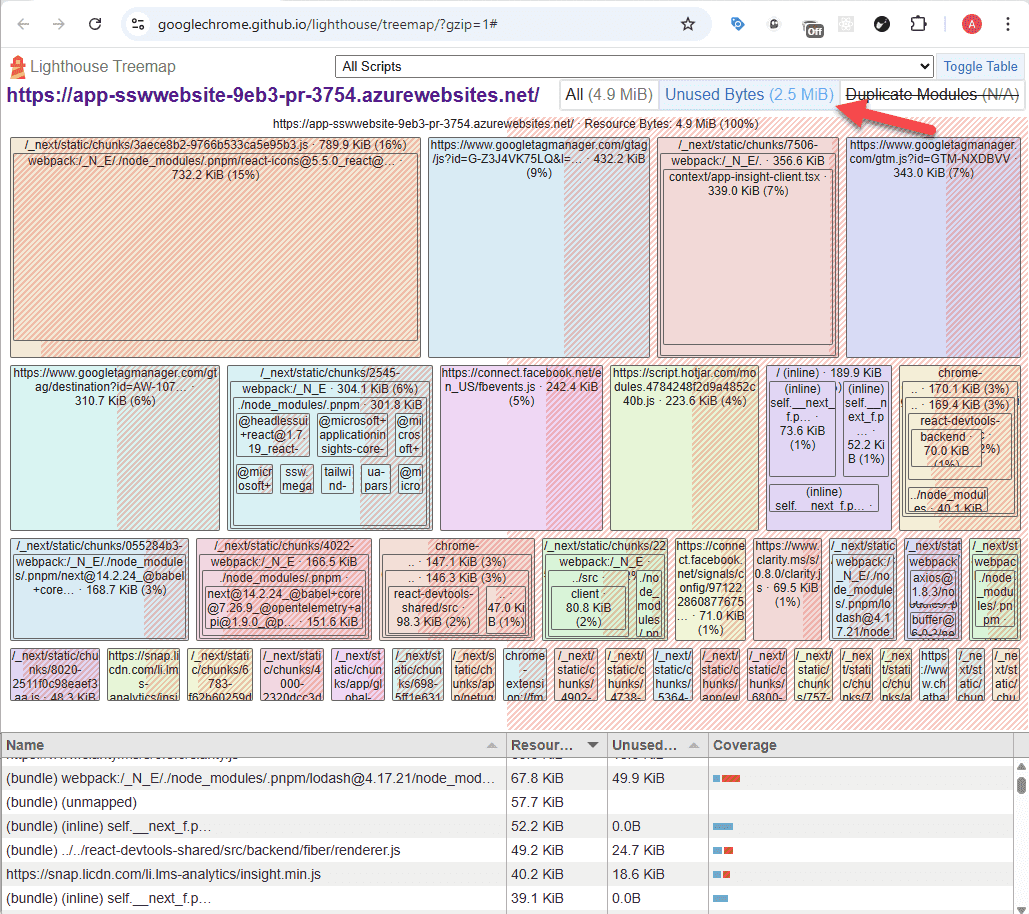
Checking the Lighthouse Treemap for bundle size
It's important to analyze the unused JavaScript in the final bundles. Lighthouse Treemap is a powerful tool to visually inspect your bundles and identify unused or unnecessary code that might be bloating your project. By checking the Lighthouse Treemap, you can identify potential issues with your code.
Find out the First Load JS Sizes for Routes
When creating static pages with dynamic content, the JavaScript size can increase as more scripts are bundled together. Monitoring the initial load JS allows you to identify these increases and optimize accordingly. Tracking this during the build process helps to pinpoint potential route causes to address.
Route (app)                     Size        First Load JS
┌ ○ /                           2.11 kB     1.31 MB
├ ○ /_not-found                 145 B       89.8 kB
├ ● /[filename]                 7.59 kB     1.32 MB
├ ├ /advertising
├ ├ /anti-slavery-policy
├ ├ /booknow
├ └ [+10 more paths]
Bash: Bad example - The initial JavaScript load size is quite huge and it is in the megabytes
Use Bundle Analyzers to identify Bundle sizes by each module
A bundle analyzer can help you visualize your JavaScript bundle, understand which modules are taking up space, and find opportunities for optimization. By using these tools, you can reduce bundle size, improve load times, and enhance your site's performance.
Bundle Analyzers for JavaScript
1. Webpack Bundle Analyzer (Recommended)
- Description: Visualizes the size of each module in a Webpack bundle, helping identify large or unnecessary files.
- Link: Webpack Bundle Analyzer
2. Next.js Bundle Analyzer (Recommended for Next.js Projects)
- Description: A specific analyzer for Next.js that shows how different parts of your app contribute to the bundle size.
-
Setup:
Install the analyzer:
npm install @next/bundle-analyzerAdd this configuration to your
next.config.js:const withBundleAnalyzer = require('@next/bundle-analyzer')({ enabled: process.env.ANALYZE === 'true', }); module.exports = withBundleAnalyzer({ // other Next.js config options });Then run the analyzer with:
ANALYZE=true next build - Link: Next.js Bundle Analyzer
3. Source Map Explorer
- Description: Analyzes source maps to visualize the size and contribution of individual files in your bundle.
- Link: Source Map Explorer
Optimizing Imports for Better Tree Shaking
How importing only what you need can reduce bundle size and improve performance.
// Importing the entire utility module, even if only one function is needed
import * as utils from "./utils";

const result = utils.expensiveFunction();
Code: Bad example - Importing entire module
// Importing only the required function
import { expensiveFunction } from "./utils";

const result = expensiveFunction();
Code: Good example - Importing only the required function
Optimize Bundle Size with Dynamic Imports and Suspense
Using dynamic imports and React Suspense helps reduce your JavaScript bundle size by loading code only when needed. This improves performance by splitting your code and reducing initial loading times.
Dynamic Imports
Dynamic imports allow you to load modules on demand, only when they're required. This avoids loading unnecessary code during the initial load.
// Without dynamic import
import { MyComponent } from './MyComponent';

// With dynamic import
const MyComponent = React.lazy(() => import('./MyComponent'));
React Suspense
React Suspense works with React.lazy() to delay the rendering of components until they are loaded. It helps avoid blocking the UI and improves user experience.
import React, { Suspense } from 'react';

// Lazy-loaded component
const MyComponent = React.lazy(() => import('./MyComponent'));

function App() {
  return (
    <Suspense fallback={<div>Loading...</div>}>
      <MyComponent />
    </Suspense>
  );
}
By optimizing imports as outlined above, you can significantly reduce the First Load JavaScript size.
Optimized Initial JavaScript Load
Route (app)                     Size        First Load JS
┌ ○ /                           2.11 kB     315 kB
├ ○ /_not-found                 145 B       89.8 kB
├ ● /[filename]                 7.59 kB     321 kB
├ ├ /advertising
├ ├ /anti-slavery-policy
├ ├ /booknow
├ └ [+10 more paths]
Bash: Good example - The First Load JavaScript size is reduced to kilobytes from megabytes.
Lighthouse Treemap
Monitor bundle size using Lighthouse on PR links
During development, it's easy to unintentionally introduce additional bundles with your PR. To track and monitor bundle sizes and performance for each Pull Request (PR), run Lighthouse audits on deployed preview links. This ensures bundle optimizations are maintained and prevents performance regressions.
The following table shows Lighthouse reports for various PR links, including Performance, Accessibility, Best Practices, SEO, Bundle Size, and Unused Bundle Size.
Example PR Check Results
| 🌐 URL | ⚡ Performance | ♿ Accessibility | ✅ Best Practices | 🔍 SEO | 📦 Bundle Size | 🗑️ Unused Bundle |
|---|---|---|---|---|---|---|
| ⭐ PR Main Page | 82 | 91 | 74 | 69 | 4.59 MB | 2.11 MB |
| Articles | 82 | 96 | 74 | 57 | 4.39 MB | 2.54 MB |
| About Us | 83 | 100 | 74 | 69 | 4.30 MB | 1.97 MB |
| Clients | 64 | 94 | 74 | 69 | 4.68 MB | 2.51 MB |
| Contact Us | 65 | 90 | 74 | 61 | 4.61 MB | 2.74 MB |
| Consulting | 78 | 90 | 70 | 69 | 4.59 MB | 2.70 MB |
| ⭐ Net Upgrade | 62 | 90 | 56 | 54 | 4.59 MB | 2.70 MB |
| ⭐ Web Applications | 75 | 98 | 74 | 61 | 4.57 MB | 2.65 MB |
✅ Benefits of PR Lighthouse Checks
- Automated Performance Monitoring: Automatically monitor performance and bundle size on every PR
- Track Bundle Size Trends: Identify if a new change increases the bundle size or if performance decreases
- Enforce Performance Standards: Set performance goals (e.g., bundle size under a certain limit) and enforce them across all PRs
